Qualitative Analysis
‘[Qualitative insights] bring statistics to life, because we now have a better idea about how a particular experience is lived. They can also make us think about the similar circumstances but also the different circumstances that may lie behind a set of statistics.’ (Haddon, 2011).
What are they and Why use them
Qualitative analysis is the process of arranging all of the gathered information into context to draw out users’ needs. In most cases, qualitative data is analysed using a bottom-up approach, also known as inductive thematic analysis, which consists of first familiarising yourself with the data and then systematically coding the data relevant to the context. This is contrasted with a top-down approach, where a set coding scheme is used to explore the data, and the researchers are looking into the data to find issues. When examining qualitative data there are two main ideas that the researcher should be considering: is what the participant telling me a facilitator or a barrier. A facilitator is a factor that benefits the user to perform tasks. Conversely, a barrier is a factor that impedes the user performing their task, which impacts them achieving their goal.
When to use them
Qualitative analysis should be performed as part of each study in which users’ perceptions are gathered to inform the design for the next task.
How to use them
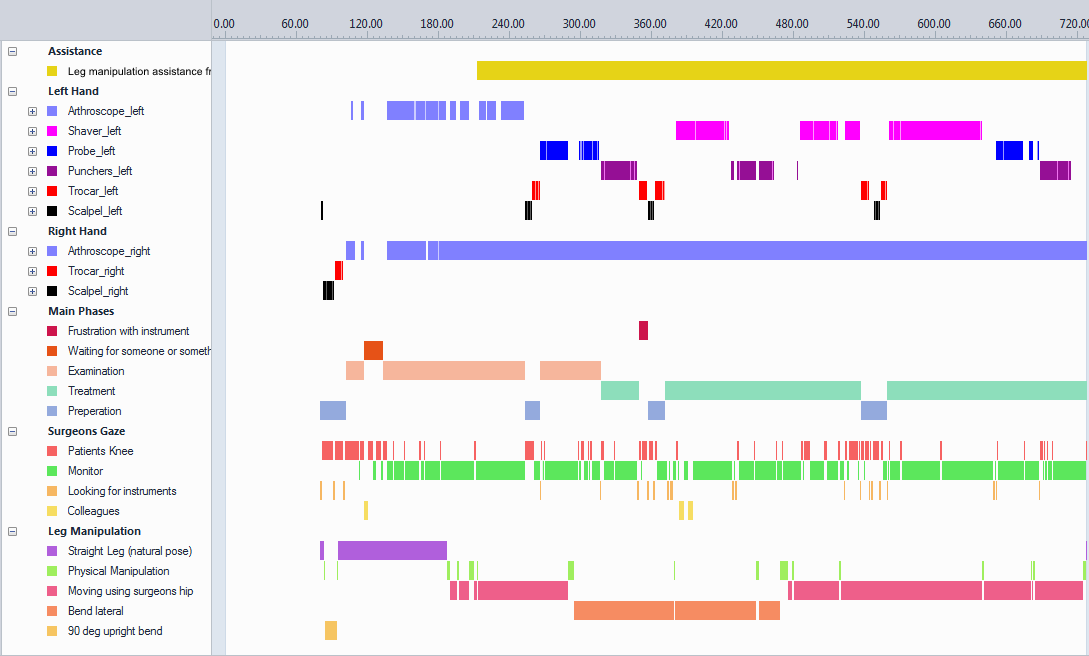
When performing a coding scheme for a thematic analysis, after familiarising oneself with the data, the researcher should be able to identify key themes within the data. From here, they would create subthemes within these key themes and begin coding the data. As they are coding, new themes may be uncovered which can be included in the coding scheme. However, when this occurs, all previously analysed data will need to be reanalysed to include the new codes. The figure below is an example of a thematic coding scheme.
There are multiple tools to help with the analysis of qualitative data, such as ATLAS.ti, MAXQDA, and NVivo. These programs allow the user to create their own set of codes and then apply them to the data. From here, the user can inspect the data for each specific code to identify barriers that inhibit the user to achieve their goals and opportunities in which improvements to processes can be made.
Pros
Gain an understanding of the users’ needs, seeing the problems and opportunities from their perspective.
Cons
Outcomes can be perceived as subjective and can be time consuming.
Points to ponder
- What key themes can you identify in the data you are exploring?
- What facilitators can be identified from the data?
- What barriers can be identified from the data?
- Who is being impacted by the barriers?